I have a rather large dataset, 44 columns and about 8k to 9k rows each month. The table has every trip that our customers have either completed or not shown up for. I have started with a simple pivot table that outputs the following:
Customer_Name comp noshow John James 4 1 Sue Stone 10 10 Chris Cole 25 0 The columns "comp" and "noshow" are simply counts of how many times in the dataset the column status is filled with the word comp or noshow. What I am trying to do is create a third column that gives the percentage of trips that are noshow. This should be a simple Percentage = noshow / comp+noshow. What I was expecting is:
Customer_Name comp noshow Percentage John James 4 1 20% Sue Stone 10 10 50% Chris Cole 25 0 0% What I'm getting are either the data for the same filled all the way down: =GETPIVOTDATA("Status",$DU$3,"Status","noshow","Clients full name","John James")/(GETPIVOTDATA("Status",$DU$3,"Status","comp","Clients full name","John James")+GETPIVOTDATA("Status",$DU$3,"Status","noshow","Clients full name","John James"))
With 410 distinct client names that can change each month, it's not practical to edit the string for the name either.
How can I accomplish what seems to me should be an easy task. (I am preparing my forehead now for something easy that I have missed!)
22 Answers
If you want to do this outside the pivot table the easiest way is to put in the formula manually.
If you click on the cell when inputting the formula you get =getpivot..., but you can manually type in =B2 and it will still reference that cell even if it is within the pivot table.
With your pivot table already created, you can use the Calculated Field feature to create a sortable column within the Pivot Table.
In Excel 2013, the navigation is PivotTable Tools > Analyze > Options > Fields, Items, & Sets > Calculated Field ...
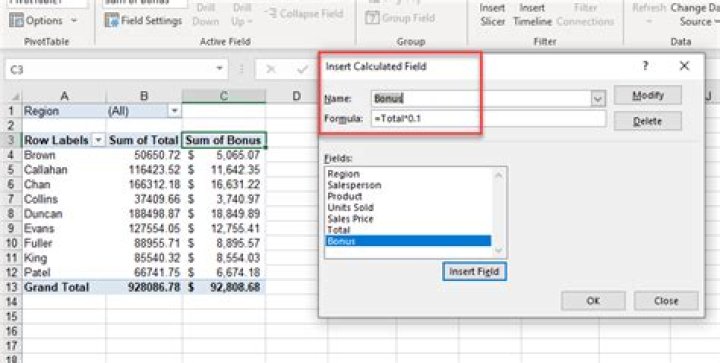
The formula I used is the same as @gtwebb: =noshow / (show +noshow )
After you have your NoShowPercentage calculated field, you can sort the results by right clicking in the cell and selecting Sort > Sort Largest to Smallest

You can see in my screenshot, the most frequent no shows appear at the top.
I partially referenced Mr. Excel's Calculating % on Two Columns for the answer.